1. Definition and Basic Concepts
1.1 What is NPSH?
Net Positive Suction Head (NPSH) is the total suction head at the pump suction flange, above the vapor pressure of the liquid, expressed in meters (or feet) of liquid.
NPSH ensures the liquid remains in liquid phase (does not vaporize) as it enters the pump impeller.
1.2 NPSHa vs NPSHr
| Term | Full Name | Definition | Determined By |
|---|---|---|---|
| NPSHa | NPSH Available | Energy available at pump suction above vapor pressure | System design (piping, tank level, pressure) |
| NPSHr | NPSH Required | Minimum energy required by pump to avoid cavitation | Pump manufacturer (from test data) |
Fundamental Requirement:
NPSHa > NPSHr + Margin1.3 Why NPSH Matters
When NPSHa < NPSHr:
- Liquid pressure at impeller eye drops below vapor pressure
- Liquid vaporizes, forming vapor bubbles (cavitation)
- Bubbles collapse violently when pressure recovers
- Implosion forces exceed 100,000 psi locally
- Results in pitting, erosion, and rapid impeller destruction
Cavitation indicators:
- Noise: crackling/rattling sound
- Vibration increase
- Head and flow reduction
- Erosion damage on impeller leading edges
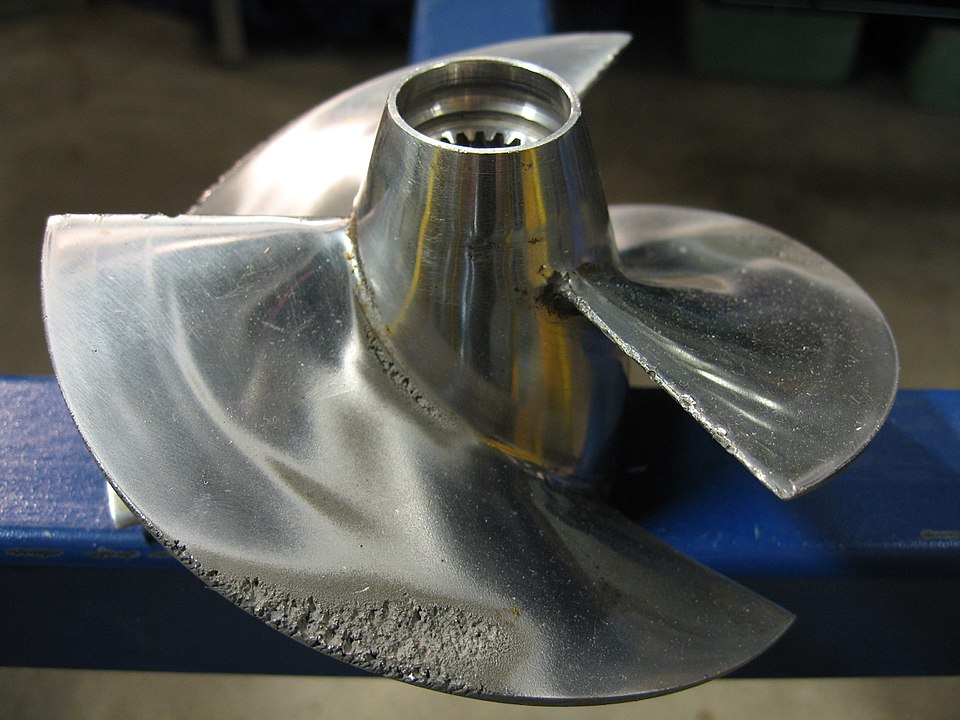
Cavitation damage on propeller showing pitting and erosion caused by collapsing vapor bubbles (Image credit: Erik Axdahl, CC BY-SA 2.5)
2. NPSHa Calculation
2.1 General Formula
NPSHa = (P_s - P_vp) / (ρ × g) + h_s - h_fWhere:
| Symbol | Description | Unit |
|---|---|---|
| P_s | Absolute pressure on liquid surface | Pa (or kPa) |
| P_vp | Vapor pressure of liquid at pumping temperature | Pa (or kPa) |
| ρ | Liquid density at pumping temperature | kg/m³ |
| g | Gravitational acceleration = 9.81 | m/s² |
| h_s | Static suction head (+ if flooded, - if lift) | m |
| h_f | Friction head loss in suction piping | m |
2.2 Alternative Form (using head terms)
NPSHa = h_atm + h_s - h_f - h_vpWhere:
| Symbol | Description | Formula |
|---|---|---|
| h_atm | Atmospheric/surface pressure head | P_s / (ρ × g) |
| h_s | Static suction head | Elevation difference |
| h_f | Friction head loss | From pipe calculations |
| h_vp | Vapor pressure head | P_vp / (ρ × g) |
2.3 Configuration: Flooded Suction
Setup: Liquid level is above pump centerline.
     ┌─────────────┐
     │    TANK     │ ← P_s (surface pressure)
     │ ════════════│ ← Liquid level
     │             │
     │    h_s (+)  │ ← Static head (positive)
     │             │
     └──────┬──────┘
            │ ← Suction pipe (friction loss h_f)
         ┌──┴──┐
         │PUMP │ ← Pump centerline
         └─────┘
Formula:
NPSHa = (P_s - P_vp) / (ρ × g) + h_s - h_fh_s is positive (adds to NPSHa).
2.4 Configuration: Suction Lift
Setup: Pump centerline is above liquid level.
         ┌─────┐
         │PUMP │ ← Pump centerline
         └──┬──┘
            │ ← Suction pipe (friction loss h_f)
            │
     │    h_s (-)  │ ← Static lift (negative)
     │             │
     ┌─────┴───────┐
     │ ════════════│ ← Liquid level
     │    TANK     │ ← P_s (surface pressure)
     └─────────────┘
Formula:
NPSHa = (P_s - P_vp) / (ρ × g) - h_s - h_fh_s is negative (subtracts from NPSHa).
Note: Suction lift configuration has lower NPSHa. Maximum practical suction lift for water at 20°C ≈ 7-8 meters due to atmospheric pressure limits.
2.5 Configuration: Pressurized Vessel
Setup: Suction from pressurized vessel (P_s > atmospheric).
     ┌─────────────┐
     │  VESSEL     │ ← P_s (vessel pressure, absolute)
     │  P = X bar  │
     │ ════════════│ ← Liquid level
     │    h_s      │
     └──────┬──────┘
            │ ← Suction pipe (friction loss h_f)
         ┌──┴──┐
         │PUMP │ ← Pump centerline
         └─────┘
Formula:
NPSHa = (P_s - P_vp) / (ρ × g) + h_s - h_fWhere:
| Symbol | Description | Unit |
|---|---|---|
| P_s | Vessel pressure (absolute) | kPa |
| P_vp | Vapor pressure at pumping temperature | kPa |
| h_s | Static head (liquid level to pump centerline) | m |
| h_f | Friction head loss in suction pipe | m |
Key advantage: Higher P_s significantly increases NPSHa. Common solution for:
- Hot condensate pumps
- Boiling liquids
- High vapor pressure fluids
3. Reference Data Tables
3.1 Atmospheric Pressure vs Elevation
| Elevation (m) | P_atm (kPa) | P_atm (bar) | Equivalent Head - Water (m) |
|---|---|---|---|
| 0 (sea level) | 101.325 | 1.013 | 10.33 |
| 500 | 95.46 | 0.955 | 9.73 |
| 1000 | 89.87 | 0.899 | 9.16 |
| 1500 | 84.56 | 0.846 | 8.62 |
| 2000 | 79.50 | 0.795 | 8.10 |
| 2500 | 74.69 | 0.747 | 7.61 |
| 3000 | 70.11 | 0.701 | 7.15 |
Formula: P_atm = 101.325 × (1 - 2.25577 × 10⁻⁵ × h)^5.2559
3.2 Water - Vapor Pressure and Density
| Temp (°C) | P_vp (kPa) | P_vp (bar) | ρ (kg/m³) | h_vp (m) |
|---|---|---|---|---|
| 10 | 1.23 | 0.0123 | 999.7 | 0.13 |
| 20 | 2.34 | 0.0234 | 998.2 | 0.24 |
| 30 | 4.24 | 0.0424 | 995.7 | 0.43 |
| 40 | 7.38 | 0.0738 | 992.2 | 0.76 |
| 50 | 12.35 | 0.1235 | 988.0 | 1.27 |
| 60 | 19.94 | 0.1994 | 983.2 | 2.07 |
| 70 | 31.19 | 0.3119 | 977.8 | 3.25 |
| 80 | 47.39 | 0.4739 | 971.8 | 4.97 |
| 90 | 70.14 | 0.7014 | 965.3 | 7.41 |
| 100 | 101.33 | 1.0133 | 958.4 | 10.78 |
| 110 | 143.27 | 1.4327 | 950.9 | 15.36 |
| 120 | 198.53 | 1.9853 | 943.1 | 21.46 |
Note: At 100°C atmospheric pressure, h_vp ≈ h_atm, resulting in NPSHa ≈ 0 for open tank.
3.3 Common Hydrocarbons - Vapor Pressure at Various Temperatures
| Liquid | 20°C (kPa) | 40°C (kPa) | 60°C (kPa) | 80°C (kPa) |
|---|---|---|---|---|
| Gasoline (typical) | 50-90 | 80-140 | 130-220 | 200-340 |
| Kerosene | 0.3 | 1.0 | 3.0 | 7.0 |
| Diesel | 0.01 | 0.05 | 0.2 | 0.6 |
| Benzene | 10.0 | 24.0 | 53.0 | 103.0 |
| Toluene | 2.9 | 7.9 | 18.4 | 38.5 |
| Methanol | 12.8 | 35.3 | 84.5 | 181.0 |
| Ethanol | 5.9 | 17.8 | 47.0 | 108.0 |
| Ammonia | 857 | 1555 | 2613 | 4138 |
| Propane | 836 | 1370 | 2110 | 3090 |
| Butane | 208 | 380 | 630 | 990 |
Note: Gasoline is a blend; vapor pressure varies by composition and Reid Vapor Pressure (RVP) specification.
3.4 Friction Loss Coefficients (K-values) for Fittings
| Fitting | K-value |
|---|---|
| 90° Elbow - Long Radius (R/D = 1.5) | 0.2 |
| 90° Elbow - Standard (R/D = 1.0) | 0.3 |
| 90° Elbow - Short Radius | 0.5 |
| 45° Elbow | 0.2 |
| Tee - Flow through run | 0.3 |
| Tee - Flow through branch | 1.0 |
| Gate Valve - Fully open | 0.1 |
| Gate Valve - 50% open | 2.1 |
| Globe Valve - Fully open | 4.0 |
| Ball Valve - Fully open | 0.05 |
| Butterfly Valve - Fully open | 0.3 |
| Check Valve - Swing type | 2.0 |
| Check Valve - Lift type | 10.0 |
| Strainer - Clean | 0.5-2.0 |
| Strainer - Fouled | 3.0-6.0 |
| Sudden Enlargement | (1 - d²/D²)² |
| Sudden Contraction | 0.5 × (1 - d²/D²) |
| Entrance - Sharp edge | 0.5 |
| Entrance - Rounded | 0.04 |
| Exit | 1.0 |
Friction head loss:
h_f = K × v² / (2g)

Where:
v = Velocity (m/s)
g = 9.81 m/s²
3.5 Pipe Friction - Hazen-Williams C Values
| Pipe Material | C Value |
|---|---|
| New steel pipe | 140 |
| New cast iron | 130 |
| Riveted steel | 110 |
| Concrete | 120 |
| PVC/PE | 150 |
| Copper/Brass | 140 |
| Old steel (10 years) | 100-120 |
| Old cast iron (20 years) | 80-100 |
| Corroded pipe | 60-80 |
Hazen-Williams formula:
h_f = 10.67 × L × Q^1.852 / (C^1.852 × D^4.87)

Where:
h_f = Friction head (m)
L = Pipe length (m)
Q = Flow rate (m³/s)
C = Hazen-Williams coefficient
D = Inside diameter (m)
4. NPSHr (Required)
4.1 Definition
NPSHr is the NPSH value at which the pump experiences a 3% head drop due to cavitation during standardized testing per HI 9.6.1 or ISO 9906.
Important: At NPSHr, cavitation is already occurring. NPSHr is not a “safe” limit—it is the threshold where damage begins.
4.2 NPSHr Characteristics
NPSHr is NOT constant. It varies with:
| Factor | Effect on NPSHr |
|---|---|
| Flow rate ↑ | NPSHr increases |
| Speed (rpm) ↑ | NPSHr increases (∝ N²) |
| Impeller eye diameter ↑ | NPSHr decreases |
| Specific speed ↑ | NPSHr increases |
NPSHr vs Flow Rate (typical pattern):
| Flow (% of BEP) | NPSHr (relative) | Notes |
|---|---|---|
| 50% | ~60% of rated | Minimum flow region |
| 75% | ~80% of rated | Part load |
| 100% | 100% (rated) | Design point |
| 110% | ~115% of rated | Maximum continuous |
| 125% | ~140% of rated | Runout condition |
Note: NPSHr increases with flow rate. At runout (125% BEP), NPSHr can be 40% higher than at rated flow.
Always check NPSHr at:
- Rated flow point
- Maximum expected flow (runout)
- Any other specified operating points
4.3 NPSHr from Pump Curve
Vendor pump curves typically show NPSHr as:
- Separate curve below H-Q curve
- Table with flow vs NPSHr values
- Single point at rated condition (minimum data)
Request from vendor:
- NPSHr at rated flow
- NPSHr at BEP
- NPSHr at maximum flow (runout)
- Full NPSHr curve if available
4.4 Suction Specific Speed (Nss)
Suction specific speed indicates cavitation resistance:
Nss = N × √Q / (NPSHr)^0.75

Where:
N = Pump speed (rpm)
Q = Flow rate per impeller eye (m³/s or GPM)
NPSHr = Required NPSH (m or ft)| Nss Range | Cavitation Resistance | Application |
|---|---|---|
| < 8,500 | Conservative, reliable | General industrial |
| 8,500-11,000 | Moderate | Most API 610 pumps |
| 11,000-13,000 | Aggressive | Special low-NPSH designs |
| > 13,000 | Very aggressive | Prone to suction recirculation |
API 610 recommendation: Nss ≤ 11,000 for standard services.
5. NPSH Margin Requirements
5.1 API 610 Margin (12th Edition)
Standard requirement:
NPSH Margin ≥ MAX(1.0 m, 0.30 × NPSHr)| NPSHr (m) | 30% of NPSHr (m) | Required Margin (m) |
|---|---|---|
| 2.0 | 0.6 | 1.0 (minimum governs) |
| 3.0 | 0.9 | 1.0 (minimum governs) |
| 4.0 | 1.2 | 1.2 (30% governs) |
| 5.0 | 1.5 | 1.5 (30% governs) |
| 6.0 | 1.8 | 1.8 (30% governs) |
| 8.0 | 2.4 | 2.4 (30% governs) |
| 10.0 | 3.0 | 3.0 (30% governs) |
5.2 High-Energy Pumps (API 610 Table 8)
For high-energy pumps, additional margins apply based on suction energy level.
Suction Energy calculation:
SE = D × N × √(NPSHr × S)

Where:
D = Impeller diameter (inches)
N = Speed (rpm)
NPSHr = Required NPSH (ft)
S = Specific gravity| Suction Energy Level | SE Value | Additional Margin |
|---|---|---|
| Low | < 160 × 10⁶ | Standard margin |
| High | 160-240 × 10⁶ | 1.5× standard |
| Very High | > 240 × 10⁶ | 2.0× or per vendor |
5.3 Hydraulic Institute Recommendations
HI 9.6.1 provides more detailed guidance based on:
- Pump type and size
- Expected service life
- Fluid properties
- Operating range
General HI recommendations:
| Service | Recommended Margin |
|---|---|
| General industrial | 0.6-1.0 m |
| Critical process | 1.5-2.0 m |
| Hydrocarbon service | 1.0-1.5 m |
| Hot water (>80°C) | 2.0-3.0 m |
| Boiler feed | 2.5-3.5 m |
6. Worked Examples
Example 1: Flooded Suction - Cooling Water
Given:
- Service: Cooling water circulation
- Flow: 400 m³/h
- Liquid: Water at 35°C
- Suction tank: Open to atmosphere, at sea level
- Liquid level: 3.5 m above pump centerline (minimum level)
- Suction piping: 200mm diameter, 6m length
- Fittings: 2× long-radius 90° elbows, 1× gate valve, 1× strainer (fouled)
- Pump NPSHr: 3.8 m at 400 m³/h
Step 1: Gather fluid properties at 35°C
- P_vp = 5.63 kPa (interpolated from table)
- ρ = 994 kg/m³
- P_atm = 101.325 kPa
Step 2: Calculate velocity and friction losses
Velocity:
v = Q / A = (400/3600) / (π × 0.2² / 4)
v = 0.111 / 0.0314 = 3.54 m/s
Friction head (fittings):
K_total = 2(0.2) + 0.1 + 4.0 = 4.5
h_f_fittings = 4.5 × 3.54² / (2 × 9.81) = 2.88 m
Friction head (pipe) using Darcy-Weisbach:
Assume f = 0.02 (typical for steel)
h_f_pipe = f × (L/D) × v²/(2g)
h_f_pipe = 0.02 × (6/0.2) × 3.54²/(2 × 9.81) = 0.38 m
Total friction:
h_f = 2.88 + 0.38 = 3.26 mStep 3: Calculate NPSHa
NPSHa = (P_atm - P_vp)/(ρg) + h_s - h_f
NPSHa = (101,325 - 5,630)/(994 × 9.81) + 3.5 - 3.26
NPSHa = 95,695/9,751 + 0.24
NPSHa = 9.81 + 0.24
NPSHa = 10.05 m
Step 4: Check margin
Margin = NPSHa - NPSHr = 10.05 - 3.8 = 6.25 m
Required margin = MAX(1.0, 0.30 × 3.8) = MAX(1.0, 1.14) = 1.14 m

6.25 m > 1.14 m ✓ ACCEPTABLE
Example 2: Suction Lift - Transfer Pump
Given:
- Service: Chemical transfer from underground tank
- Flow: 50 m³/h
- Liquid: Methanol at 25°C
- Tank: Underground, vented to atmosphere
- Pump elevation: 4.0 m above liquid surface
- Suction piping: 80mm diameter, 8m length
- Fittings: 3× standard 90° elbows, 1× foot valve (K=2.5)
- Pump NPSHr: 2.5 m at 50 m³/h
Step 1: Gather fluid properties at 25°C
- P_vp = 16.9 kPa (from reference)
- ρ = 787 kg/m³
- P_atm = 101.325 kPa
Step 2: Calculate velocity and friction
Velocity:
v = (50/3600) / (π × 0.08² / 4) = 2.76 m/sFriction (fittings):
K_total = 3(0.3) + 2.5 = 3.4
h_f_fittings = 3.4 × 2.76² / (2 × 9.81) = 1.32 m
Friction (pipe):
h_f_pipe = 0.022 × (8/0.08) × 2.76²/(2 × 9.81) = 0.86 mTotal friction:
h_f = 1.32 + 0.86 = 2.18 mStep 3: Calculate NPSHa (suction lift - negative h_s)
NPSHa = (P_atm - P_vp)/(ρg) - h_s - h_f
NPSHa = (101,325 - 16,900)/(787 × 9.81) - 4.0 - 2.18
NPSHa = 84,425/7,720 - 6.18
NPSHa = 10.94 - 6.18
NPSHa = 4.76 m
Step 4: Check margin
Margin = NPSHa - NPSHr = 4.76 - 2.5 = 2.26 m
Required margin = MAX(1.0, 0.30 × 2.5) = MAX(1.0, 0.75) = 1.0 m

2.26 m > 1.0 m ✓ ACCEPTABLE
Example 3: Hot Condensate Pump (Critical Case)
Given:
- Service: Condensate return from deaerator
- Flow: 80 m³/h
- Liquid: Water at 105°C
- Deaerator pressure: 120 kPa absolute (0.2 barg)
- Liquid level: 2.0 m above pump centerline (minimum)
- Suction piping: 150mm, 3m length (short, large pipe for low friction)
- Fittings: 1× long-radius elbow, 1× gate valve
- Pump NPSHr: 1.8 m at 80 m³/h
Step 1: Gather fluid properties at 105°C
- P_vp = 120.8 kPa (water boils at 105°C at ~121 kPa)
- ρ = 955 kg/m³
- P_s = 120 kPa (vessel pressure)
Step 2: Calculate velocity and friction
Velocity:
v = (80/3600) / (π × 0.15² / 4) = 1.26 m/sFriction:
K_total = 0.2 + 0.1 = 0.3
h_f = 0.3 × 1.26² / (2 × 9.81) = 0.024 m
Pipe friction (negligible for short, large pipe):
h_f_pipe ≈ 0.02 mTotal friction: h_f ≈ 0.05 m
Step 3: Calculate NPSHa
Problem identified: P_s (120 kPa) < P_vp (120.8 kPa)
The vessel pressure is below the vapor pressure! This means:
NPSHa = (120,000 - 120,800)/(955 × 9.81) + 2.0 - 0.05
NPSHa = -800/9,369 + 1.95
NPSHa = -0.085 + 1.95
NPSHa = 1.87 m
Step 4: Check margin
Margin = NPSHa - NPSHr = 1.87 - 1.8 = 0.07 m
Required margin = 1.0 m

0.07 m < 1.0 m ✗ NOT ACCEPTABLE
Solution options:
- Increase deaerator pressure to 150 kPa (+3.2 m NPSHa)
- Increase liquid level to 4.0 m (+2.0 m NPSHa)
- Select pump with lower NPSHr (≤0.87 m)
- Install inducer to reduce effective NPSHr
7. Design Guidelines
7.1 Suction Piping Best Practices
| Parameter | Recommendation | Reason |
|---|---|---|
| Pipe size | ≥ 1 size larger than pump suction | Reduce velocity, friction |
| Velocity | < 1.5 m/s (water), < 1.0 m/s (hydrocarbons) | Minimize friction loss |
| Straight length | ≥ 5D before pump suction | Uniform flow distribution |
| Reducer | Eccentric, flat side up | Prevent air pocket |
| Elbows | Long-radius preferred | Lower K-value |
| Valves | Gate or ball (full port) | Minimal restriction |
| Strainer | Size for low ΔP, include fouling allowance | Prevent excessive loss |
7.2 Methods to Increase NPSHa
| Method | NPSHa Increase | Notes |
|---|---|---|
| Raise liquid level +1 m | +1.0 m | Most direct method |
| Reduce friction 50% | +0.3-1.0 m | Larger pipe, fewer fittings |
| Reduce temperature 10°C | +0.3-0.5 m (water) | Process dependent |
| Pressurize vessel +100 kPa | +10 m | Adds equipment cost |
| Lower pump position | +height difference | Space/layout dependent |
7.3 Methods to Reduce NPSHr
| Method | NPSHr Reduction | Notes |
|---|---|---|
| Larger impeller eye | 20-40% | Pump redesign |
| Lower speed | 30-50% at half speed | Per affinity laws (∝ N²) |
| Double-suction impeller | 20-30% | Different pump type |
| Inducer | 50-70% | Added component |
7.4 NPSHa Calculation Checklist
Always calculate at worst-case conditions:
- Minimum liquid level (not normal)
- Maximum operating temperature
- Maximum flow rate (for friction)
- Fouled strainer condition
- Minimum vessel pressure (if variable)
- Include all suction piping losses
- Check at startup/transient conditions
- Verify NPSHr at maximum flow, not just rated
8. Troubleshooting Guide
8.1 Cavitation Symptoms and Causes
| Symptom | Possible Causes | Verification |
|---|---|---|
| Crackling/rattling noise | NPSHa < NPSHr | Check suction pressure, temperature |
| Reduced head and flow | Severe cavitation | Compare to pump curve |
| Fluctuating discharge pressure | Intermittent cavitation | Check for vortex, air ingress |
| Impeller erosion (pitting) | Prolonged cavitation | Inspect impeller |
| Bearing/seal damage | Cavitation-induced vibration | Vibration analysis |
8.2 Field Verification of NPSHa
Measure actual NPSHa:
NPSHa_actual = (P_suction_gauge + P_atm - P_vp)/(ρg) + v²/(2g)Install pressure gauge at pump suction flange. Measure during operation.
Common discrepancies from calculated NPSHa:
- Higher friction than calculated
- Lower tank level than design
- Higher temperature than design
- Fouled strainer
- Partially closed valve
- Air leakage in suction line
8.3 Corrective Actions
| Problem | Immediate Action | Long-term Solution |
|---|---|---|
| Low suction pressure | Increase tank level, check valve position | Redesign suction system |
| High temperature | Add cooling | Install cooler, modify process |
| Fouled strainer | Clean strainer | Install larger strainer, add DP alarm |
| Air ingress | Seal leaks, check vortex | Redesign suction line, add vortex breaker |
| Operating off-curve | Adjust flow to design | Resize pump or modify system |
9. Quick Reference Summary
NPSHa Formula
NPSHa = (P_surface - P_vapor)/(ρg) ± h_static - h_frictionAPI 610 Margin
Margin ≥ MAX(1.0 m, 30% of NPSHr)Key Rules
- NPSHa must exceed NPSHr + Margin at all operating conditions
- Calculate at worst case: min level, max temp, max flow
- NPSHr increases with flow—check at maximum flow
- At NPSHr, cavitation is already occurring (3% head drop)
- Suction velocity should be < 1.5 m/s for water
Quick Estimation
- Atmospheric pressure head (water, sea level) ≈ 10.3 m
- Vapor pressure head (water, 20°C) ≈ 0.24 m
- Vapor pressure head (water, 60°C) ≈ 2.0 m
- Vapor pressure head (water, 100°C) ≈ 10.3 m (equals atmospheric)
Image Credits
| Image | Source | License |
|---|---|---|
| Cavitation Damage on Propeller | Erik Axdahl - Wikimedia Commons | CC BY-SA 2.5 |